

Bond Yields Are Back. Alright!
(October 15, 2026).
Bonds are back. Alright! (Cue the ‘90s boy band choreography) For the first time in what feels like years, I’m not writing about AI. This quarter’s main character isn’t a chipmaker with a valuation larger than most countries’ GDP. It’s the asset class most people ignore until it shows up in a mortgage quote. Yes, really, bonds. Try to contain your excitement.
And yes, I’m jazzed that bonds look attractive, but that doesn’t mean they’ve had a good few years. Quite the opposite. For bonds to come back, they usually have to fall out of favor first, and the pain that pushed yields higher is exactly what makes them worth owning again. Below, we’ll walk through why yields rose, what it means for your portfolio, and where we see value (and where we don’t).
Exhibit A: Mortgage Rates Hit 7.28%
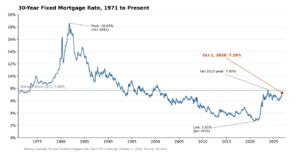
For proof that it was a rough quarter, skip the yield curve and ask anyone who has shopped for a house lately. The average 30-year fixed mortgage rate reached 7.28% on October 1st, up from 6.49% at the end of June and almost a full percentage point above where it stood a year ago (6.30%).1 Outside of a brief stretch in the fall of 2023, it’s the highest reading since the Backstreet Boys were ruling the charts in December 2000, and it’s 130 basis points above the February low of 5.98%.
Source: YCharts
To any potential home buyers reading this: I genuinely feel your pain, and I mean this sincerely as a recent homebuyer myself. But here’s some perspective that might make you feel better. Today’s rates are actually closer to the historical norm. Since 1971 the average 30-year mortgage rate has been 7.68%, so today’s rate sits slightly below the long-run average.1 In the 1980s the average was 12.7%, and the lowest reading of the entire decade was 9.03%. A buyer in 1985 would have a sub-10% rate framed and hung up on their wall. The real outlier was 2009 through 2021, when mortgage rates averaged about 4% and bottomed at 2.65% in January 2021. We got a decade of the cheapest mortgages in history and somehow decided that was the baseline.
It’s Not Just Mortgages: Bond Yields Rose Across the Board
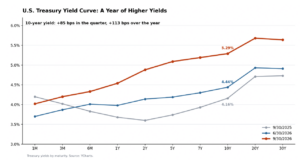
Mortgage rates are the most visible symptom of higher bond yields. Mortgages take their cue from the 10-year Treasury, which ended September at 5.29%, up from 4.73% a month earlier and 4.16% a year ago.2 Yields rose across the board, not just at the long end: the 2-year Treasury climbed to 4.88% from 3.60% a year ago,2 and investment-grade corporate yields followed (BBB at 6.22%, AAA at 5.83%).3
Bond prices move opposite to yields, so performance took a hit this year. The broad U.S. bond market lost 3.51% in the quarter and is down 2.91% for the year, with global bonds down 2.46% and 2.67% over the same periods.4 The pain spread to other rate-sensitive corners of the market: U.S. real estate fell 5.90% and small caps fell 7.23%. Large caps held up, gaining 2.30%, which keeps them up 12.75% for the year. International developed stocks also finished positive for the quarter at +0.81%.
Why Did Bond Yields Rise? Four Culprits
The short answer: everything, and all at once. The 10-year Treasury yield went from 4.44% at the end of June to 5.29% at the end of September, its highest level since 2002.2 No single culprit did this. It was a pile-on.
Culprit #1: Oil. The continuation of the war with Iran sent oil from around $70 a barrel at the start of the quarter to above $100 for stretches of September. Energy prices are up 16.3% from a year ago, and headline inflation is running at 3.4%.5 Tariffs add some pressure on goods prices, but the effect is barely visible in core inflation. The Fed noticed the energy problem anyway: on September 16 it raised rates for the first time since 2023 and signaled more raises are in our future.6 Bond investors don’t love being surprised by the Fed.
Culprit #2: Government Spending. The Congressional Budget Office projects this year’s federal deficit at 5.8% of GDP, rising to 6.7% by 2036, with debt held by the public climbing from 101% to 120% of GDP.7 More borrowing means more Treasuries for the market to absorb, and the market is asking for a higher yield to do it. This kind of borrowing outside of recession or major war is historically unusual.
Culprit #3: The AI buildout. Big tech is borrowing hundreds of billions of dollars to build data centers, and when the biggest borrowers in the world show up at once, the rest of the market has to make room. The result? Higher yields.
Culprit #4: Foreign buyers are less enthusiastic. Foreign official holdings of US Treasuries are down roughly $236 billion since February, to about $3.77 trillion.8 Not a stampede for the exits, but a less enthusiastic buyer matters when the country is borrowing at this rate.
What Rising Yields Mean for Your Portfolio
If you are locked in a low mortgage rate and not taking out additional debt, you likely don’t feel the direct pain of higher yields. Instead, higher yields are felt in your investment portfolio. Rising yields push bond prices down, which is why the broad U.S. bond market is down 2.91% this year and has returned -0.64% annualized over five years.4 Thankfully, it’s not all doom and gloom. The same move raised what bonds pay. Investment-grade corporate bonds now yield nearly 6%,3 and every maturing bond can be reinvested at those levels instead of 2021’s.
So after a quarter like this, the natural question is whether the damage has created opportunity. Let’s take a look at where the value is.
Where We See Value in Bonds Now
The good news about a tough quarter like this is that investors are finally being paid to own bonds. The broadest measure of the U.S. bond market now yields about 5.5%, up from 4.4% a year ago, and investment-grade corporates yield around 6%.9 Within that, municipal bonds look the most interesting. They sold off harder than Treasuries this quarter, and for an investor in the top federal tax bracket, a 10-year AAA muni now offers a tax-equivalent yield of about 6.4%, versus roughly 5.2% for the 10-year Treasury and 6.0% for A-rated corporates.9 Agency mortgage-backed securities also look relatively attractive, yielding about 6.3% and backed by government-sponsored credit.
Longer-maturity bonds are starting to look more interesting as well, especially in municipals and high-quality credit, where the yield curve is steeper. But it isn’t free: the long end lost more than 6% this quarter, and if yields keep climbing, longer duration will hurt first.9
Tight Credit Spreads: What Still Looks Expensive
Not everything in the bond market looks like a screaming buy right now. Corporate credit spreads, the extra yield investors earn over Treasuries for taking credit risk, widened a bit this quarter but remain historically tight.10 In plain English, you aren’t getting paid much extra to buy a corporate bond relative to a risk-free treasury, and heavy new issuance from AI borrowers doesn’t help. We’d rather take our fixed income exposure from Treasury bonds, municipals, and high-quality securitized bonds where spreads look more attractive relative to their own history.
With equities still expensive and well on their way to a fourth consecutive double-digit return year,11 we don’t expect that rally to continue in perpetuity. With bonds yielding near our long term expectation for equities, bonds warrant a deeper look. This isn’t a call against stocks, but with yields where they are, in a competition for client capital, bonds are more competitive again. For clients in higher tax brackets, municipal bonds look especially attractive.
The Bottom Line on Bonds
After a year in which bonds did their best roller coaster impression, the takeaway is less dramatic than the headlines. Higher yields hurt on the way up, but they pay you more going forward. We aren’t trying to call the top in yields, and with oil, deficits, and a Fed still leaning hawkish, they could go higher before they come back down. What we can say is that bonds are earning their place in the portfolio again.
As always, if you have questions, please reach out. Thank you for your trust and confidence.

BLUE Impact Update – Q3 2026
 To underscore our commitment to making the world a better place through responsible investing, we spotlight a positive impact achieved by one of our fund managers through their sustainable investments. Calvert is a responsible investing leader with a dual mandate to create long-term value for clients while driving positive global change, guided by the Calvert Principles for Responsible Investment and research focused on financially material issues. Central to this approach is active stewardship, combining direct company engagement, often alongside other investors, with research-driven proxy voting.
A recent example of this approach is Calvert’s engagement with Dollar Tree, a U.S. discount retailer, on store safety. Before 2022, underinvestment in store infrastructure, understaffing and low wages had contributed to frequent safety violations and workplace violence. Following an activist-led proxy contest that brought a CEO transition and new board members, Calvert and other investors engaged the company from 2022 to 2024 to support its turnaround, encouraging stronger regulatory compliance, workplace safety oversight and transparency around violence prevention. Dollar Tree hired key personnel to address violations and workplace violence, resulting in a dramatic reduction in OSHA violations and gun-related incidents in its stores. Dollar Tree, historically the highest among its peers in violent incidents per million square feet, saw its rate inflect after the engagement; by 2025, according to Calvert, it was meaningfully lower than that of its peers.
Calvert’s engagement shows how sustained dialogue can turn a material workplace risk into measurable progress, protecting workers while strengthening the foundations of long-term value.
Citations
This commentary reflects the views of Riverwater Partners as of October 14, 2026 and is subject to change without notice. It is provided for informational purposes only and does not constitute personalized investment advice or a recommendation to buy or sell any security. Riverwater Partners does not guarantee the accuracy or completeness of this information and is not responsible for any errors or omissions. Past performance is not indicative of future results. Indices are unmanaged and cannot be invested in directly. Bond prices fall when interest rates rise, and municipal bond interest may be subject to the federal alternative minimum tax or state and local taxes. Clients or prospective clients should consult their financial advisor before making any investment decisions.