Riverwater Partners believes that sustainable companies perform better. Our highly integrative process can enable our clients to invest according to their values while also opening up the possibility of not only no performance disadvantage but, as is our goal over the long term, a performance advantage.
For many years, the primary approach taken by “responsible” investors was to screen out certain types of holdings, such as tobacco and weapons firms.
Investors in these strategies were implicitly willing to risk missing out on potential gains when companies in excluded categories performed well.
However, historical data has generally shown that screening out a relatively small proportion of a total investment universe is likely to have little to no effect on long-term performance.
So, in today’s “ESG integration,” to the extent negative screens are used, we believe they are unlikely to “cost” investors at all. But there’s a newer, vital dimension as well: applying ESG analysis to help inform investment decisions about what to own, not just what not to own.
Do sustainable companies perform better?
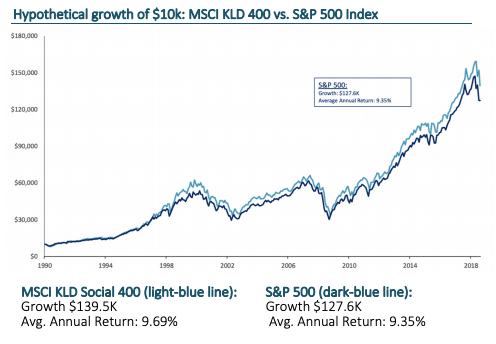
Perhaps one of the best historical snapshot views of ESG performance over time comes by way of the MSCI KLD Social 400 Index. This index is particularly valuable for historical purposes because it dates back to 1990.
The following chart demonstrates the outperformance of the MSCI KLD Social 400 Index vs. the broad-based S&P 500 Index over nearly 30 years. Not only is there no performance disadvantage, there is actually a performance advantage achieved by the social index.

ESG Growth Chart vs. S&P 500 Index: 2000-2019
It’s worth noting, too, how the MSCI KLD Social 400 Index* is formed.
The 400 U.S. companies that comprise the index vary over time. They are primarily large companies, but the index does include mid-cap and small-cap firms as well. Specific companies are selected for the index based on a combination of:
- Negative screens to exclude firms associated with several categories, such as alcohol, tobacco and firearms.*
- Positive emphasis on firms with high ESG ratings (as evaluated and assigned by MSCI). Because the MSCI KLD Social 400 goes beyond simple negative screens, its performance begs an important question: “What if companies were selected not only based on screens and ESG criteria, but those factors together with traditional fundamental analysis?”
That’s where the concept of “ESG integration” comes into play. The idea here— and we at Riverwater are strong believers in it—is that ESG factors are most productively applied in combination with time-tested investment approaches, such as value investing.
At Riverwater, we apply a fairly limited number of exclusionary screens, which may include client-directed exclusions. Therefore, our starting universe is considerably larger than that of the MSCI KLD Social 400 Index discussed above, given the Index’s far greater exclusionary focus.
But then, after applying our limited screens, we are far more selective than the index. In our investment process, we consider ESG factors and conduct intensive investment analysis to ultimately select those companies with the greatest opportunity for long-term financial and societal impact.
We believe this highly integrative process can enable our clients to invest according to their values while also opening up the possibility of not only no performance disadvantage but, as is our goal over the long term, a performance advantage.
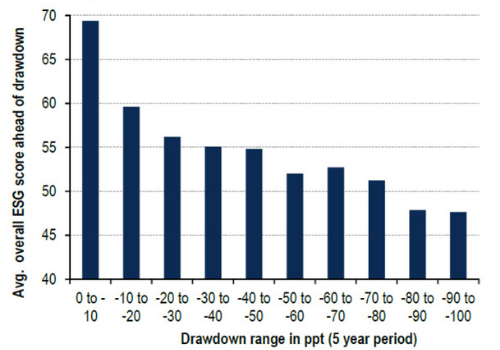
Average ESG Score Ahead of Price Declines**

Average ESG score ahead of price declines chart
Bar height indicates average overall ESG score ahead of price declines, grouped by maximum peak to trough price decline over a 5-year period (2005-2010).
ESG INVESTMENT ANALYSIS
At Riverwater, we view ESG investment analysis as essential for wise decision-making at a very basic level, in the sense that it’s useful not only for making good investment decisions that are consistent with investors’ values but also for making good investment decisions, period.
Intuitively, it’s clear that ESG factors are vital to companies’ business and prospects. Data bears out the relatedness of ESG score to traditional investment considerations, such as volatility.
For example, the chart above reflects an important point: companies that experience a drastic downturn—such as 80-90% or 90-100% of their market values (the two right-most bars)—tend to have significantly lower ESG scores than companies that experience more mild downturns (the left-hand bars).
To us, the lesson is clear: attending to ESG factors is a must, as doing so can help weed out companies with hidden pitfalls. In this way, ESG investment analysis is a risk mitigation tool.
*https://www.msci.com/msci-kld-400-social-index
**Thompson Reuters (2013). Corporate Responsibility Ratings: Ranking Rules and Methodologies.


