

Let Your Winners Run: Why SMID-Cap Investing May Be the All-Star Strategy Your Portfolio Needs –
 Picture a baseball team forced to trade their all-stars just as they hit their stride. Each season, rising stars who drove the team’s success are replaced with rookies or aging veterans – a strategy that would cripple any franchise’s competitive edge.
This scenario plays out regularly in small-cap portfolios when top performers graduate to mid-cap status and exit the Russell 2000 benchmark, leaving investors to watch their hard-earned gains walk off the field.
But what if there was a better way to build your investment lineup?
The Russell 2500: Keeping Your Investment All-Stars
Enter the Russell 2500 benchmark – a more comprehensive approach that keeps both small and mid-cap players on your roster. This strategy allows investors to retain their all-stars through their prime performing years, potentially generating additional alpha in the process.
The Power of a Deeper Bench
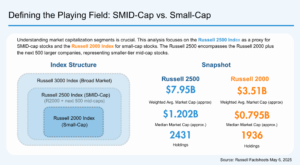
The Russell 2500 index comprises the same 2,000 small-cap companies found in the Russell 2000, with 500 select mid-cap companies from the lower half of the Russell Midcap Index. This expanded roster has proven its worth over time:
- Superior Performance: Since 1997, the Russell 2500 (SMID-cap) has outperformed the Russell 2000 (Small-cap) in 90% of rolling three-month periods, averaging a 0.80% advantage.
- Greater Resilience: In eight out of nine negative return years for small-caps since 1995, the Russell 2500 outperformed the Russell 2000 by an average of 2.12 percentage points. We believe this consistency stems from the index’s ability to retain its winning securities rather than being forced to trade them away.
The Small-Cap Constraint: Why Russell 2000 Mandates Stifle Returns
Strict adherence to the Russell 2000 as a benchmark can create an unintended headwind—forcing managers to sell their best-performing holdings just as they are proving their long-term value.
When a stock graduates beyond the small-cap threshold, it is often still in the early innings of its growth trajectory. Being tied to a small-cap-only benchmark means managers must exit positions that could continue compounding value, ultimately capping potential returns.
A Larger Small-Cap Index
In our view, many investors mistakenly view the Russell 2500 as a hybrid of small- and mid-cap stocks. In reality, it’s better described as a “larger small-cap” index rather than a true blend. The data backs this up: the Russell 2500’s median market cap exceeds the Russell 2000 by just $400 million, and its average by $3 billion. In contrast, the Russell Midcap is significantly larger—its median market cap is $9.4 billion higher than the Russell 2500, and its average is a full $24.6 billion more.
And despite these size differences, investors don’t need to worry about substantially different return streams—the correlation between the Russell 2500 and the Russell 2000 since 1995 is an astounding 0.9983. That means you can hold on to your top performers longer without straying from your core small-cap exposure.
Riverwater’s Sustainable Value Strategy: Historical Risk and Return Profile
At Riverwater Partners, we understand the advantage of letting winners run. Rather than adhering to arbitrary cutoff points, our Sustainable Value Strategy allows us to hold high-quality companies as they mature, so long as they continue to meet our fundamental investment criteria. We believe that this philosophy helps us capture more upside and reduces the unnecessary churn that can erode returns over time.
As shown in the chart below, the strategy has achieved strong long-term results while maintaining lower volatility—a testament to the power of holding on to great businesses as they grow and compound value.
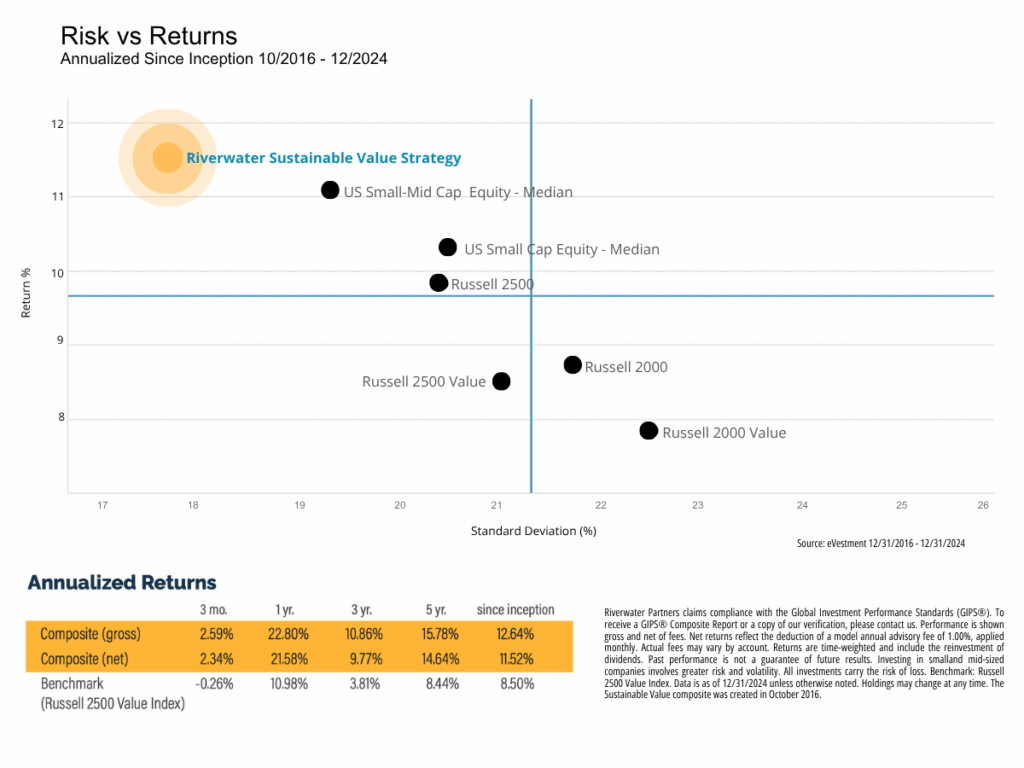 This real-world performance reinforces our belief that SMID-cap investing offers a smarter way to capture alpha—without taking on excess risk or being constrained by arbitrary index rules.
The Curious Case of the Overlooked All-Star Investment Strategy
 Despite this impressive track record, SMID-cap investing remains surprisingly underutilized.
- Russell 2000 ETFs command over $75 billion in assets
- Russell 2500 ETFs manage just $1.5 billion – a mere 2% of small-cap index fund assets.
Why such a dramatic disparity?
The answer lies partly in artificial boundaries. Many active managers assume their existing mid-cap allocation provides adequate coverage, drawing rigid lines between “small” and “mid” caps. Yet these same managers often struggle to generate alpha or outperform the Russell 2000 benchmark.
Additionally, since SMID strategies don’t fit neatly into traditional small or mid-cap investment categories, allocators hesitate to embrace them. This rigid thinking comes at a cost: historical data shows SMID-cap stocks typically deliver comparable or superior returns with lower volatility than their small-cap counterparts. By implementing a reference point based on the Russell 2500, we believe investors can reduce overall portfolio risk and enhance return.
Rounding the Bases: A Call for Holistic Thinking
Investment success, like championship baseball, requires adaptability and strategic thinking. Rather than forcing your winners to stop at second base, why not let them round third and head for home?
The evidence supports this approach: the Russell 2500 has consistently delivered
- Superior performance
- Reduced risk
- Greater investment flexibility compared to the Russell 2000
- Lower turnover costs
At Riverwater Partners, we advocate for this thoughtful, long-term approach to small-cap investing, with sustainability at its core. Don’t let artificial boundaries limit your portfolio’s potential – let your winners run.
Ready to optimize your small-cap strategy? Riverwater Partners specializes in responsible SMID-cap investing that focuses on long-term growth. Contact our institutional team or visit riverwaterpartners.com for more insights.
This commentary reflects the views of Riverwater Partners as of May 2025 and is subject to change without notice. It is provided for informational purposes only and does not constitute investment advice or a recommendation to buy or sell any securities. References to specific securities are for illustrative purposes only and may not be representative of all client portfolios. Any forward-looking statements or forecasts are based on assumptions that may not come to pass. Past performance is not indicative of future results. Investors should consult their financial adviser before making any investment decisions. These projections represent Riverwater’s internal estimates based on publicly available information and are not guarantees of future performance. Riverwater Partners and its clients may hold positions in the securities discussed, which may create a conflict of interest.
Links to third-party sites are provided for convenience and do not imply endorsement. Riverwater is not responsible for the accuracy or content of external data or sites.