

Small-Cap Macro Commentary | Q3 2026 — Adam Peck, Co-Founder & Chief Investment Officer
Ten Years of Responsible Small-Cap Investing
This past spring marked a decade since Riverwater opened its doors, and we were delighted to celebrate the milestone with our valued clients and friends a few weeks ago. We have a lot to be proud of. Since the Sustainable Value strategy’s inception in 2016, it has outperformed the Russell 2500 Value Index net of fees, with lower volatility as measured by standard deviation and beta, although results have varied from year to year.1
It’s enlightening to look back and reflect on how much the world has changed in just ten years. In 2016, interest rates were near zero, few adults had ever experienced a global airborne pandemic, and artificial intelligence was just beginning to move from science fiction to the real world. Most small-cap companies were not reporting on sustainability initiatives, and we often had to explain to management teams the benefits of doing so.
Fast forward to today, and we are navigating an environment marked by elevated inflation and higher interest rates, the scars of COVID, an economy now firmly driven by AI, and widespread market appreciation for sustainable business practices.
Our team is asking: What will the next ten years look like, and how must our approach evolve to satisfy our core mission? There is no way to see out that far, but we don’t think it’s necessary to. We have built a team, a process, and a framework that we believe can adapt to the ever-changing world and deliver results over the long term.
Small Caps in a Narrow, AI-Driven Market
Thinking long term while managing capital in the short term can be frustrating, especially in markets as narrow as today’s. Investors have become almost singularly focused on AI, energy, and companies that haven’t yet turned profitable, leaving high-quality companies in other sectors largely overlooked.
We began building exposure to AI infrastructure, semiconductor capital equipment and optical components early in the buildout for our small-cap strategies, and those holdings were key performance drivers over the past year in those strategies. As valuations outpaced sales and cash flows, we trimmed or sold most of those positions, which pushed turnover above our historical norm. We have redeployed that capital into companies we believe offer more attractive long-term risk and reward.
Oil Prices, Inflation, and the Fed’s First Hike
Higher oil prices are both inflationary and act as a direct tax on the consumer. To curb this energy-driven inflation, the Federal Reserve raised short-term interest rates at its September meeting.2 Interest rates matter for everything: inflation, stock valuations, real estate, you name it. Notably, the Fed has not begun a hiking cycle after an oil surge this large in more than four decades. This cycle stands apart: oil is up roughly 60% in the past year versus a median decline of 4% ahead of the prior seven rate-hiking cycles since 1983.3
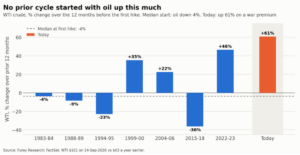
The key question is whether energy-driven headline inflation will seep into goods and services prices, pushing up core inflation and unanchoring long-anchored inflation expectations.
The war in the Persian Gulf makes oil supply, and by extension inflation and the Fed’s path, genuinely unknowable. What we do know is how small-caps have fared historically in these environments.
How Small Caps Perform After a Fed Rate Hike
On average, the Russell 2000 has gained 4% twelve months after the first hike, with a median return of 8%. Across the seven prior cycles, the twelve-month return ranged from -13% (2022) to +19% (2015).4 The future direction of near-term returns for small-caps in a rate-hiking cycle is a coin flip. History tells us that small caps prefer core inflation below 2.5%, with the strongest median returns when it is also falling.
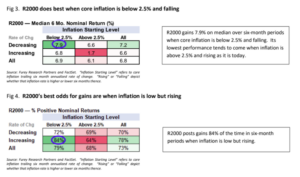 Based on the chart above, current conditions place us squarely in the weakest cell of the top table: core inflation remains modestly above 2.5% (it was 2.6%) and rising as of the last CPI report for August. This is the one setting where small-caps have historically done the worst.5 We won’t pretend to know when the trend reversal will occur. History suggests it will eventually turn, and small-caps have posted their strongest median six-month returns when core inflation is below 2.5% and falling. We’d rather own the right businesses going into that shift than try to time it.
We will continue to invest in companies that generate superior returns in their responsibly deployed human, physical, and financial capital. It is the discipline we have followed for a decade. As always, thank you for your trust and confidence. Please reach out with any questions.
Adam Peck
Co-Founder & Chief Investment Officer, Riverwater Partners
Citations
<div id=”footnote4″ style=”font-size: 0.9em; margin-bottom: 10px;”>4 Furey Research Partners; FactSet. Russell 2000 price return over the 12 months following the first hike of each of the seven prior Federal Reserve tightening cycles since 1983.
The Russell 2000 Index measures the performance of the small-cap segment of the U.S. equity universe. The Russell 2500 Value Index measures the performance of the small- to mid-cap value segment of the U.S. equity universe. Indices are unmanaged and cannot be invested in directly.
The information provided herein reflects the opinions of Riverwater Partners, LLC as of the date of publication and is subject to change without notice. It is provided for informational and educational purposes only and should not be construed as investment advice or a recommendation to buy or sell any security. Past performance is not indicative of future results. Investing involves risk, including the potential loss of principal. Indices cannot be invested in directly and are unmanaged. Riverwater Partners does not guarantee the accuracy or completeness of this information and is not responsible for any errors or omissions. Clients or prospective clients should consult their financial advisor before making any investment decisions. Riverwater Partners is a Registered Investment Advisor with the U.S. Securities and Exchange Commission (SEC).