

The Brewers won the World Series. We’re a Milwaukee firm, so you’ll forgive us for enjoying this one.
There’s an investing point here, too. The Brewers ranked 19th out of 30 teams in payroll, at about $146 million. They spent less than most of the league and won anyway.1 They built around speed and putting the bat on the ball, which costs less than paying up for home-run hitters.
That approach should sound familiar to small-cap investors. A smaller price tag can leave room for a lot of productive work. The challenge is finding it, paying a sensible price, and staying disciplined when the market is celebrating something else.
Payroll doesn’t guarantee a ring, and market cap doesn’t guarantee future returns. We believe discipline on price eventually gets paid.
Small-Cap Valuations Still Trade at a Discount
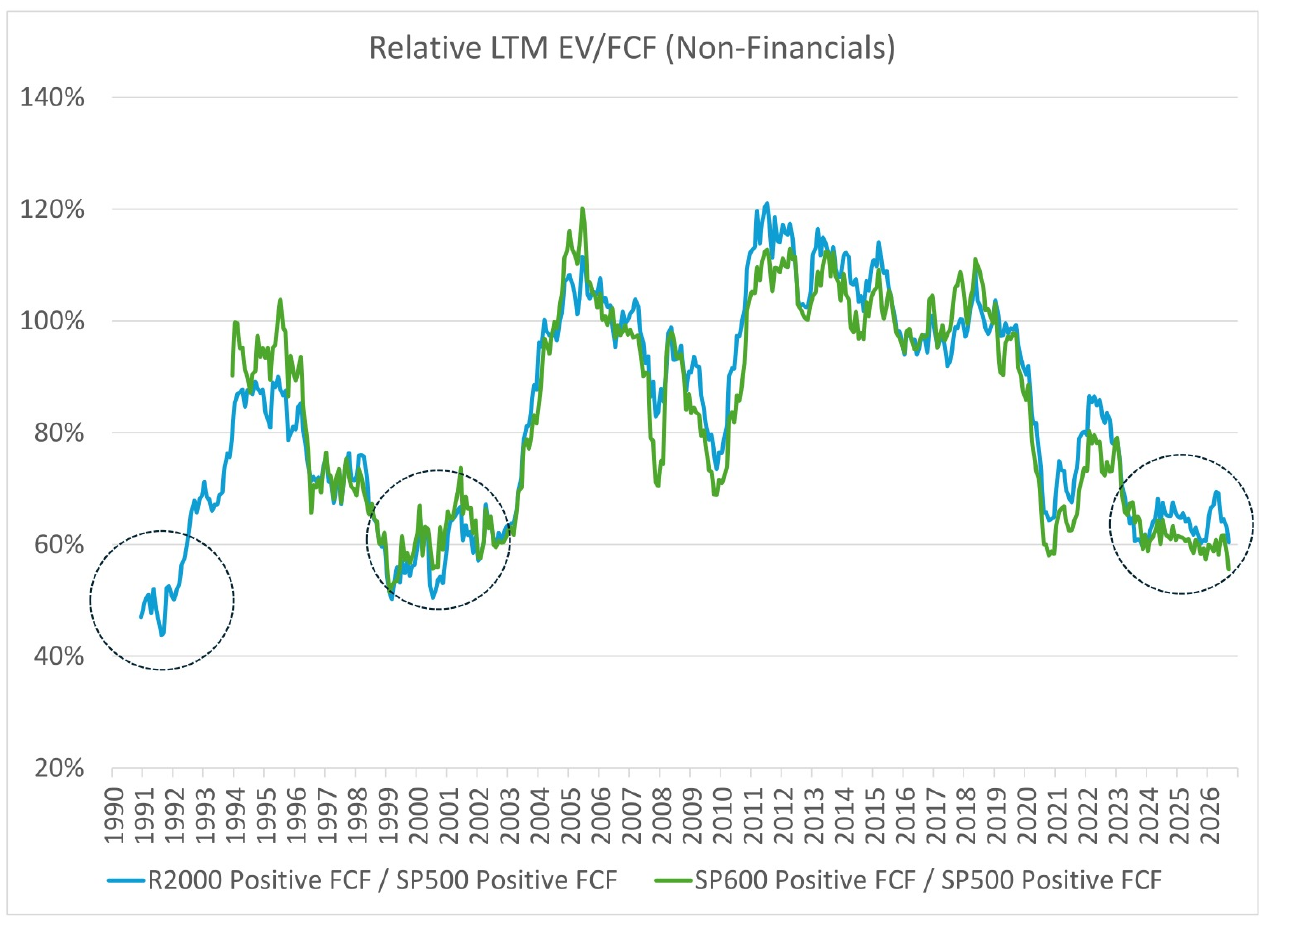
In our July 29 valuation comparison, small caps traded at about 19 times earnings versus 29 times for large caps, a discount of roughly 34%.2 By the end of the third quarter, the S&P SmallCap 600, which requires profitability for inclusion, still traded at roughly 80% of the S&P 500’s earnings multiple. Its long-run average is above parity.3
Free cash flow tells much the same story, perhaps more clearly. Among nonfinancial companies generating positive free cash flow, small-cap enterprise-value-to-free-cash-flow multiples were roughly 60% of the comparable large-cap multiple at September 30. Similar discounts appeared in the early 1990s and around 1999 to 2002.3
Those are the types of businesses we like to own: profitable companies with strong balance sheets and cash coming through the door. We believe the price paid for those fundamentals matters, even when investors are focused on the biggest names on the scoreboard.
Source: Furey Research Partners, FactSet. Data as of September 30, 2026.
Small-Cap Earnings Growth Is Doing the Work
A low valuation is more interesting when the business underneath it is improving.
Small-cap earnings fell for roughly two years, beginning in late 2023. At the bottom, Russell 2000 trailing earnings were down nearly 25% from their starting point. By September 30, 2026, they had recovered that decline and were about 13% above October 2023 levels.4
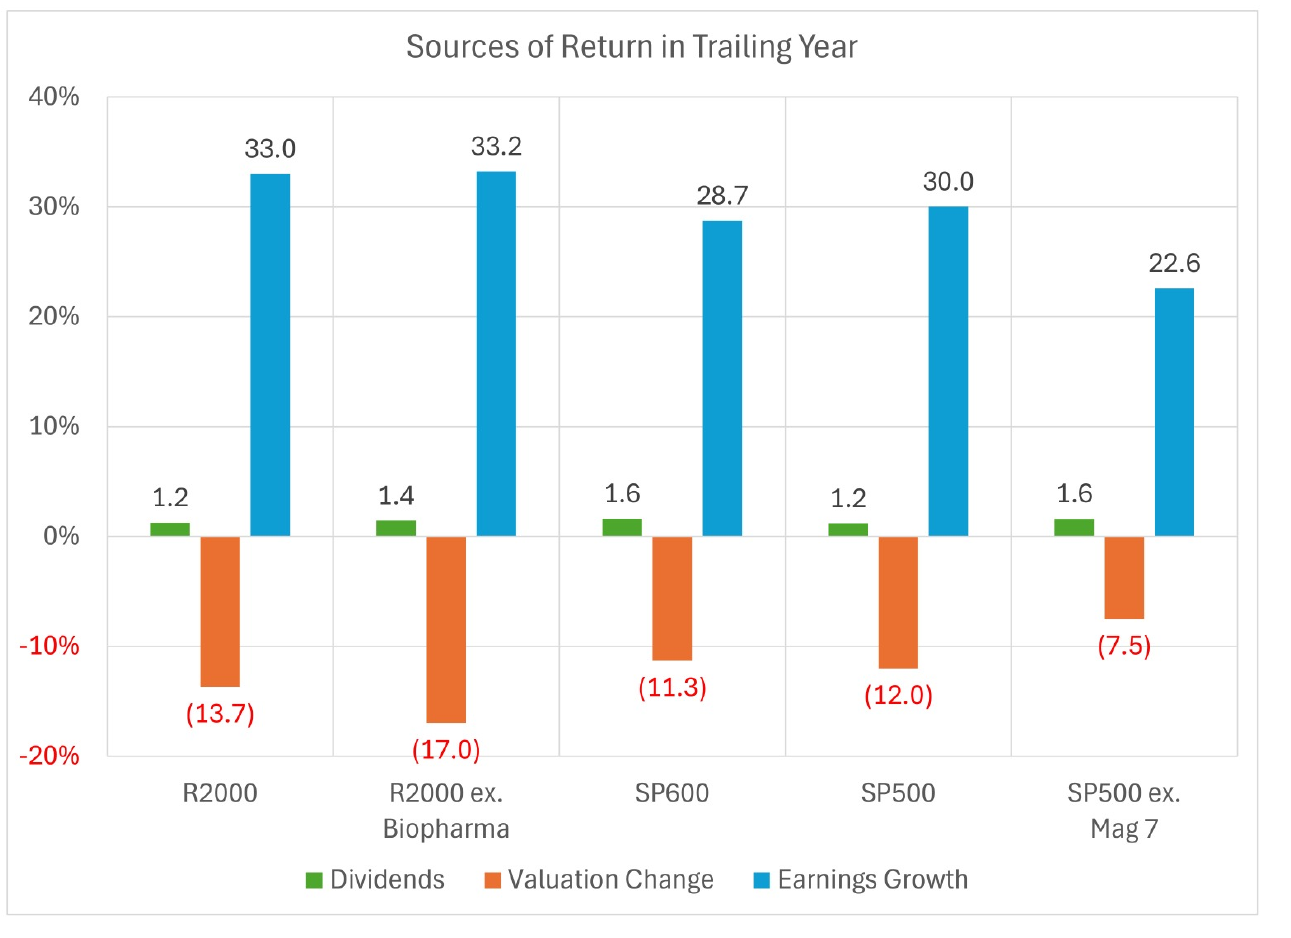
The breakdown of the past year’s returns is encouraging. Russell 2000 earnings grew 33%, while its valuation multiple contracted almost 14%. The pattern held across the large- and small-cap indexes in our analysis.4
The market didn’t get more expensive over that period. It got cheaper, and earnings did the work. That’s the kind of rally we like to see.
Source: Furey Research Partners, FactSet. Data as of September 30, 2026.
Year-over-year small-cap earnings growth is running around 30%. Eventually, that growth rate will slow, and people will call it “peak growth.” Historically, a slowing growth rate has not necessarily meant earnings stopped rising. In earlier recoveries, earnings continued to grow after the rate of growth peaked.5
For investors, there’s a difference between a business improving more slowly and a business getting worse. Keeping that distinction in view helps us assess what we’re paying for.
Why Profitable Small Caps Have Lagged
Now, the harder part. A good process can have a difficult stretch, and the last 18 months have been difficult for managers like us.
Profitable Russell 2000 companies have historically tended to outperform the full index. Over the 18 months through September, however, they lagged by about four percentage points a year. Returns were also unusually concentrated: in historical 18-month periods when the Russell 2000 gained at least 30%, the top 50 stocks typically contributed about 20% of the gain. Recently, their contribution was closer to half.6
Put those together, low-quality leadership and narrow returns, and active managers have had a hard time. The average small-cap core fund trailed the index by about 12 percentage points over the last 18 months, the weakest result in the history shown in our analysis.6
We experienced that. The market rewarded what we don’t own. When you own profitable businesses with strong balance sheets, a market led by unprofitable companies is going to make itself felt.
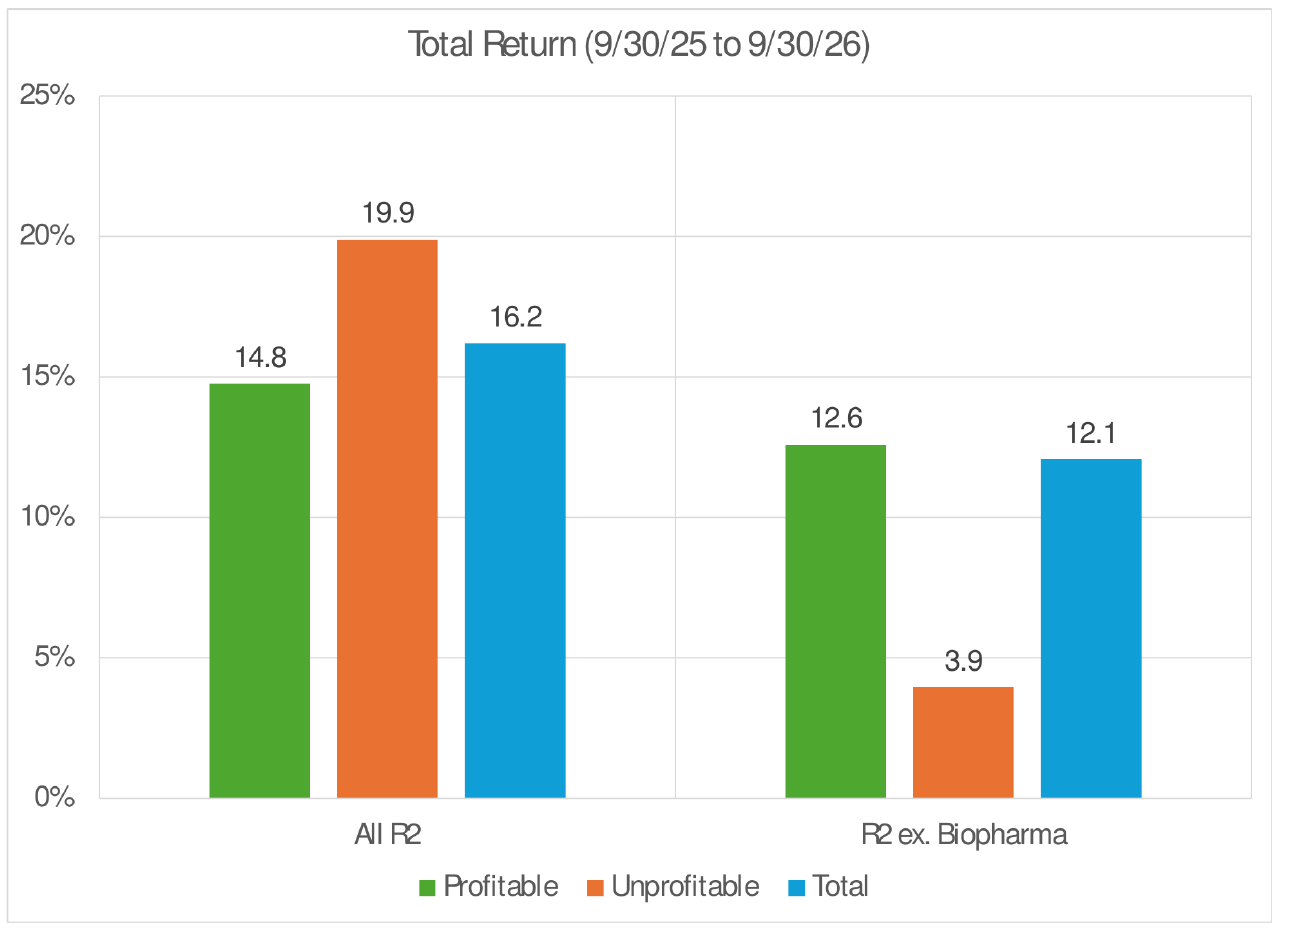
Biopharma explains a lot of the difference. Over the year ended September 30, unprofitable Russell 2000 stocks returned 19.9%, compared with 14.8% for profitable stocks. Remove biopharma, and the picture flips: profitable companies returned 12.6%, while unprofitable companies returned 3.9%.7
Outside that one industry, quality worked fine.
Source: Furey Research Partners, FactSet. Total returns, September 30, 2025, through September 30, 2026.
Staying Disciplined on Quality and Valuation: Putting the Bat on the Ball
Periods like this have happened before. In 1999 and again in 2020, profitable companies underperformed sharply and then recovered strongly relative to the broader index. In between were long stretches when profitable businesses quietly outperformed.6
We don’t know the timing of the next turn. We do know that a difficult stretch deserves a close look at the businesses we own, the prices we pay, and whether the reasons for owning them still hold.
That brings me back to the Brewers. They built a team around the things they could do well at a price they could afford. Speed. Contact. Putting the bat on the ball.
Our approach to small caps has a similar discipline. We look for profitable businesses with strong balance sheets, and we pay close attention to valuation. Today, we see recovering earnings and substantial discounts to larger companies, alongside a market that has made that discipline uncomfortable.
The Brewers gave Milwaukee plenty to celebrate. For investors, they also offered a useful reminder. We believe discipline on price eventually gets paid.
Citations
The Russell 2000 Index measures the performance of the small-cap segment of the U.S. equity universe. The Russell 1000 Index measures the performance of the large-cap segment of the U.S. equity universe. The S&P 500 Index measures the performance of 500 leading large-cap U.S. companies. The S&P SmallCap 600 Index measures the performance of the small-cap segment of the U.S. equity market and applies profitability criteria for inclusion. The iShares Russell 2000 ETF (IWM) and iShares Russell 1000 ETF (IWB) seek to track the Russell 2000 Index and Russell 1000 Index, respectively.
The information provided herein reflects the opinions of Riverwater Partners, LLC as of the date of publication and is subject to change without notice. It is provided for informational and educational purposes only and should not be construed as investment advice or a recommendation to buy or sell any security. Past performance is not indicative of future results. Investing involves risk, including the potential loss of principal. Indices cannot be invested in directly and are unmanaged. Riverwater Partners does not guarantee the accuracy or completeness of this information and is not responsible for any errors or omissions. Clients or prospective clients should consult their financial advisor before making any investment decisions. Riverwater Partners is a Registered Investment Advisor with the U.S. Securities and Exchange Commission (SEC).