

Bottom of the Lineup, Top of the Charts
Like our hometown team, the Milwaukee Brewers, small caps have spent the better part of fifteen years out of favor—grinding out singles and doubles while mega-caps launched moonshots. This season, both are reminding us that cycles turn, and that discipline can ultimately trump pure scale.
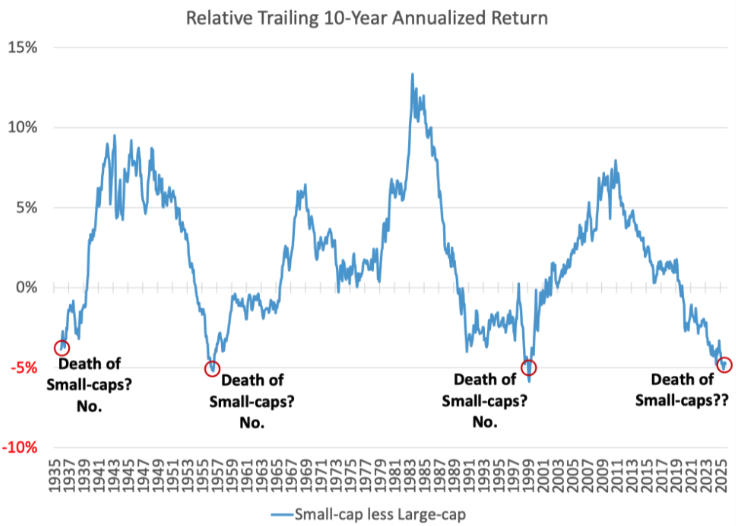
Source: Furey Research Partners
The Brewers’ 2025 run offers the perfect parallel for what’s emerging in small caps. With a payroll sitting at the edge of the bottom quartile—roughly half the average of other playoff contenders—they’ve posted the best record in baseball. When they face the Dodgers in the next round, they’ll be operating at just 35.8% of LA’s spending power. Yet here they are, competing at the highest level through culture, efficiency, and smart resource allocation.
Brewers Payroll Compared to MLB Leaders
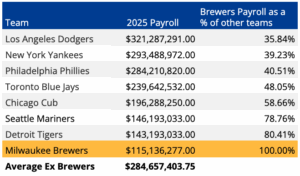
Source: USA Today. April 2, 2025
The Echo of Capital: AI Capex and the Internet Buildout
“If we end up misspending a couple of hundred billion dollars, I think that that is going to be very unfortunate, obviously,”
– Mark Zuckerberg, CEO of Meta.
Source: Sherwood News, September 2025
The resonance of today’s AI capex boom feels familiar—an echo of the internet buildout of the late 1990s. Back then, capturing “eyeballs” and laying fiber was paramount; today, it’s Nvidia chips, model training, and power access. Both eras share the same reflex: companies feel they have no choice but to spend—quickly and massively—to stay competitive. If the CEOs of today’s hyperscalers openly acknowledge that they might misspend hundreds of billions, we’re likely somewhere near the midpoint of a speculative phase. The beginning of a bubble, perhaps—but one that may still have innings to play.
In the late 1990s, capital flooded into telecom and internet infrastructure. Fiber was laid across continents. By 2001, capacity had far exceeded demand and it’s estimated that only 5% of what was laid was in use. Yet, that “overspend” paved the way for decades of cheap bandwidth and our ability to download movies in a couple of minutes or less. The bubble was real, but so were its long-term real world impacts.
The Scale of Today’s AI Capex Bet
Today’s AI capex cycle shares that same duality–potentially excessive in the near term, but transformative in the long run. Bulls argue that this cycle is different because the hyperscalers are profitable today. We would counter that AT&T, Verizon, the local exchange carriers and cable companies were also very profitable as they spent to build out internet infrastructure. Consider the magnitude: 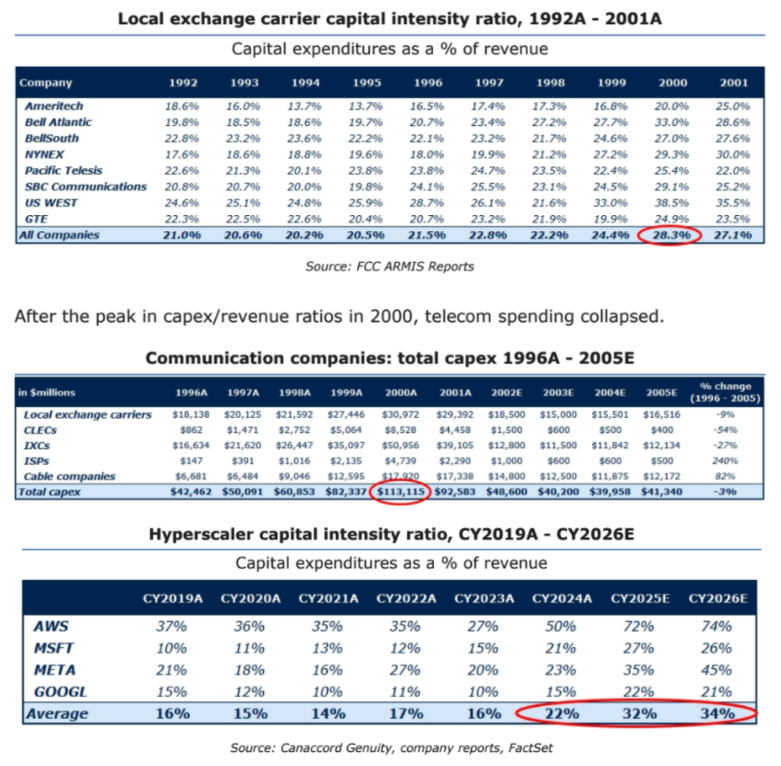
-
-
- Capex intensity has doubled: Communication companies increased capex as a percent of sales by roughly 50% during the 1990s buildout. Today’s hyperscalers have doubled their capex-to-sales ratios compared to just a few years ago.
- The total commitment: Morgan Stanley estimates that $2.9 trillion will be spent from 2025-2028 on data center buildouts alone.
- The return hurdle: For the hyperscalers to earn sufficient returns on this capital comparable to their existing business, they’ll need to generate at least a trillion dollars in incremental annual cash flow. We think that is unlikely over the next several years.
-
Interestingly, the big spenders during the internet buildout were not the largest beneficiaries of that spend over the following decade. Their profits and stocks declined, while companies that leveraged the infrastructure they built grew their profits and their stocks benefitted. Yet high expectations embedded in mega-cap valuations stand in stark contrast to small caps, where we would argue there are hardly any expectations at all. And small caps should be direct beneficiaries of the efficiency gains AI ultimately delivers.
Why This Matters for Small Caps
This cycle has the potential to be the great equalizer for smaller companies. The AI buildout is pushing capital into physical infrastructure, services, and supply chains—precisely where small caps live.
Three Reasons to Pay Attention Now
1. Participation is Expanding
We currently have around 10-15% of our small cap portfolios with direct sales to the AI buildout. They are among our best performers this year. As the AI ecosystem grows beyond the hyperscalers, demand increasingly flows into second-order beneficiaries: component makers, service providers, and infrastructure specialists. The other 85-90% of our portfolios should benefit from AI in one form or another as it trickles through our economy.
One amazing stat is that it took 2 months for ChatGPT to reach 100 million users. That compares to over 100 months for Uber, 300 months for the TV and 500 months for the telephone.
2. Valuation Opportunity is Compelling
After fifteen years of underperformance, small caps now trade at historically wide discounts to large caps. The Russell 2000 currently trades at a forward P/E of approximately 16x versus 21x for the S&P 500—a 24% discount that’s wider than the 15-year average discount of roughly 10-15%. Mean reversion alone could drive significant outperformance, even before considering improved fundamentals.
Small caps outperformed large caps by 6.2% in Q3 2025 and finally broke through their 2021 all-time high in late September, reaching new record levels for the first time in over three years.
3. Operating Leverage Accelerates Returns
When small caps move, they move fast. Earnings acceleration from even modest top-line growth can be dramatic given their leaner cost structures and higher operational leverage. A 10% revenue increase for a small cap can translate to 20-30% earnings growth, compared to single-digit incremental margins for mature large caps.
Managing the Risks
We remain hypervigilant about valuations in our AI-exposed holdings. The signs of weakness we’re monitoring include: deteriorating lead times for AI components, inventory builds at hyperscalers, and guidance cuts from bellwether suppliers. Should these warning signs emerge, we’re prepared to rotate capital toward the broader small cap opportunity set where valuations remain compelling.
The answer lies partly in artificial boundaries. Many active managers assume their existing mid-cap allocation provides adequate coverage, drawing rigid lines between “small” and “mid” caps. Yet these same managers often struggle to generate alpha or outperform the Russell 2000 benchmark.
Additionally, since SMID strategies don’t fit neatly into traditional small or mid-cap investment categories, allocators hesitate to embrace them. This rigid thinking comes at a cost: historical data shows SMID-cap stocks typically deliver comparable or superior returns with lower volatility than their small-cap counterparts. By implementing a reference point based on the Russell 2500, we believe investors can reduce overall portfolio risk and enhance return.
The Sound of Small Caps Getting Back in the Game
Just as the Brewers are proving that execution, culture, and resource discipline can compete with—and beat—teams spending twice as much, small caps are reminding investors that focus and resilience can outperform size and narrative.
The echo we’re hearing isn’t just nostalgia. It’s the sound of a cycle turning, of capital beginning to rotate, and of smaller companies positioned to benefit both from the AI buildout itself and from the productivity gains it will ultimately deliver.
After fifteen years in the wilderness, small caps are stepping back up to the plate.
Ready to optimize your small-cap strategy? Riverwater Partners specializes in responsible SMID-cap investing that focuses on long-term growth. Contact our institutional team or visit riverwaterpartners.com for more insights.
This commentary reflects the views of Riverwater Partners as of October 2025 and is subject to change without notice. It is provided for informational purposes only and does not constitute investment advice or a recommendation to buy or sell any securities. References to specific securities are for illustrative purposes only and may not be representative of all client portfolios. Any forward-looking statements or forecasts are based on assumptions that may not come to pass. Past performance is not indicative of future results. Investors should consult their financial adviser before making any investment decisions. These projections represent Riverwater’s internal estimates based on publicly available information and are not guarantees of future performance. Riverwater Partners and its clients may hold positions in the securities discussed, which may create a conflict of interest.
Links to third-party sites are provided for convenience and do not imply endorsement. Riverwater is not responsible for the accuracy or content of external data or sites.