

Q3 2022 Market and Riverwater Strategies Update
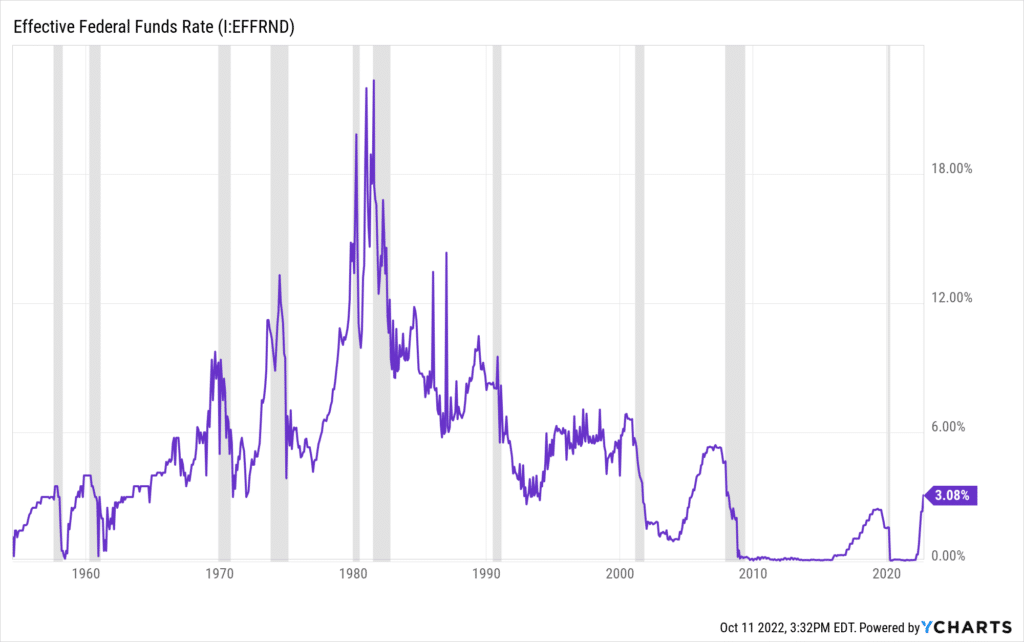
Stock and bond market volatility persisted in the third quarter as the Federal Reserve continued to respond to high inflation by raising the Fed Funds rate. So far in 2022, the Fed has increased rates by 300 basis points, from effectively 0% to 3%. The last time the Fed raised rates this quickly was in the early 1980s and the market expects at least another 1-1.5% increase by sometime in 2023. This would bring the Fed Funds rate well above 4%, a level consistent with longer-term levels, and as you can see in the chart below, one we have not seen since 2006.
 It appears that the absolute level of inflation may have peaked this summer. This is evidenced by major moves lower in several inflation inputs in the last few months: oil is down 33% from July levels, lumber is down 70% from its March peak, and copper is down 32% since March as well. Additionally, higher rates finally seem to have put a pin in the ballooning of home prices, with mortgage rates having doubled from 2.88% last year to well over 6% today, a direct result of the Fed’s actions.
We have been consistent in our belief that the economy would slow based on the forward-looking data points we pay attention to: the yield curve, leading economic indicators and initial unemployment claims. As these data points continue to weaken in the face of higher interest rates, the die looks to be cast for an economic slowdown in 2023.
This is normal; the economy has cycles. We have been fortunate in a post WWII era which has been dominated by long up-cycles followed by much shorter contractions. The most recent contraction in 2020 might have been the shortest on record, and the last time the economy had a contraction of traditional duration was The Great Financial Crisis (GFC) of 2008 (the GFC contraction was actually longer than average). The GFC was driven by a housing bubble that destroyed the balance sheets of the banking system. Today, the financial sector is not at risk like it was in 2008 and we think the market is getting close to fully pricing in any normal economic slowdown that comes our way.
The adage to buy low and sell high still holds. Valuations in equities have been cut across the board and many companies are trading at the cheapest valuations we have seen in the last twenty years. Stock market returns are driven by (1) the growth in corporate earnings, and (2) the price investors are willing to pay for those earnings. The price investors are willing to pay often is driven by investor sentiment. When investors are greedy, they are willing to pay more for stocks. When they are fearful, they are willing to pay less for those same stocks. Historically, investor sentiment has been an accurate contrarian indicator.
Investor sentiment is best measured by the American Association of Individual Investors (AAII) which has queried investors weekly since 1987. It asks if they are bullish, bearish, or neutral. Lows in investor sentiment over the last twenty years have consistently marked bear market bottoms – almost to the exact date! The chart below compares lows in the stock market to lows in investor sentiment. You can see that when the majority of people were bearish, the markets were at or very close to a bottom.
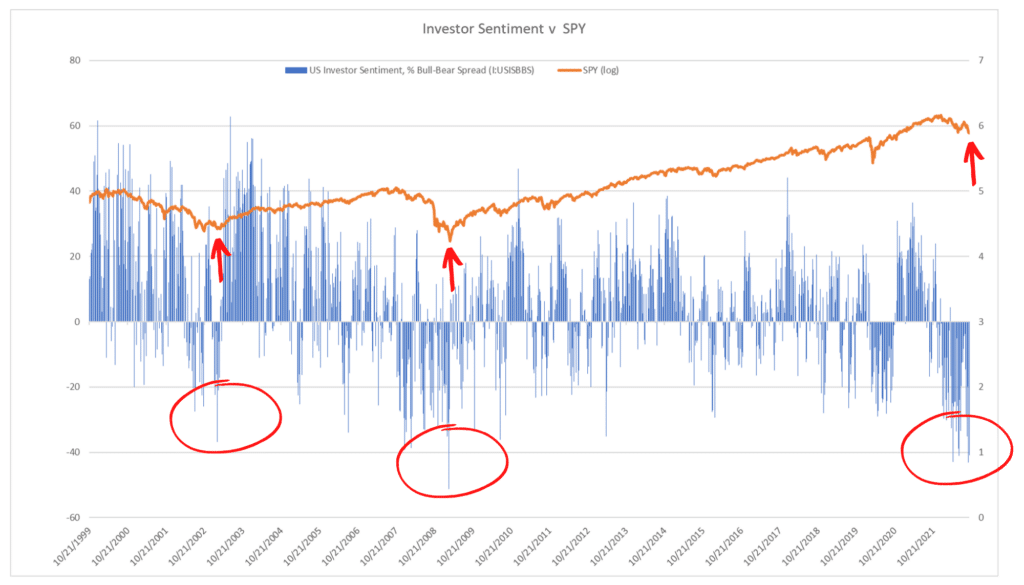 As you can see by the extreme negative blue bars, investor sentiment is as low today as at the depths of the GFC. This actually surprises us. While there is much to worry about on a geopolitical basis and the cost of living and doing business is going up, the economy is in better shape today than it was back in 2008. So, if (1) the Federal Reserve does indicate that a pause is in order or that we are at the end of the rate hiking cycle, and (2) the economic slowdown is of normal magnitude, we think equity markets will actually do better next year. The stock market (as measured by the S&P 500) has gone up 75% of the years since 1926 and it is up 91% of the years following down markets since WWII. It seems to be certain the stock market will end the year in the red, so again we think odds are better than average for gains in 2023.
We look forward to updating you on our thoughts on the markets over our fall and winter meetings and should you have any questions in the interim please let us know. Especially if you feel uneasy with the recent volatility. Keep in mind that if you feel uneasy it usually means it is a great time to buy low.
Please also mark your calendar for our annual holiday party on December 8th at Camp Bar in the Third Ward (in Milwaukee).
All the best,

Adam
Disclosures: The information contained within this market and strategies update represents the opinion of Riverwater Partners and should not be construed as personalized or individualized investment advice.
![]()
- Riverwater ESG SMID Value Strategy
- Riverwater ESG Micro Opportunities Strategy
- Riverwater ESG Large Value Strategy
![]()