

Why Quality Underperformed in 2025
(And Why We Think History Suggests a Reversal)
It was a tough year for active managers who invest in quality companies. Not just for us at Riverwater, but across the board. According to Furey Research Partners, growth, core, and value managers all underperformed in 2025. Among core managers, only 16% beat their benchmarks for the full year.
The culprit was a persistent low-quality rally — one that began on April 8th and ran for the better part of nine months. Low-quality stocks outperforming is actually quite common coming out of bear markets, and 2025 had its own bear market episode following Liberation Day. But knowing that intellectually and living through it are two very different experiences. For those of us running concentrated, quality-focused portfolios, 2025 was a year of daily paper cuts — trailing by 10, 20, sometimes 40 basis points a day, not because of blow-ups in the portfolio, but simply because the market rewarded the wrong things.
The Numbers Behind the Low-Quality Rally
The data tells the story plainly. Among small-cap factors in 2025, the biggest winners were the ones most quality-focused investors avoid: high short interest stocks gained 32%, companies with negative free cash flow rose 24%, and high bankruptcy risk names climbed 23%. Meanwhile, the quality factors we favor told a very different story. Companies with high return on equity were up just 8.9%. Low-leverage companies managed only 4.7%.
When the best quality factors return less than 10% and the worst fundamental characteristics drive gains north of 20%, stock selection among quality names becomes an uphill battle — regardless of how well your individual companies execute.
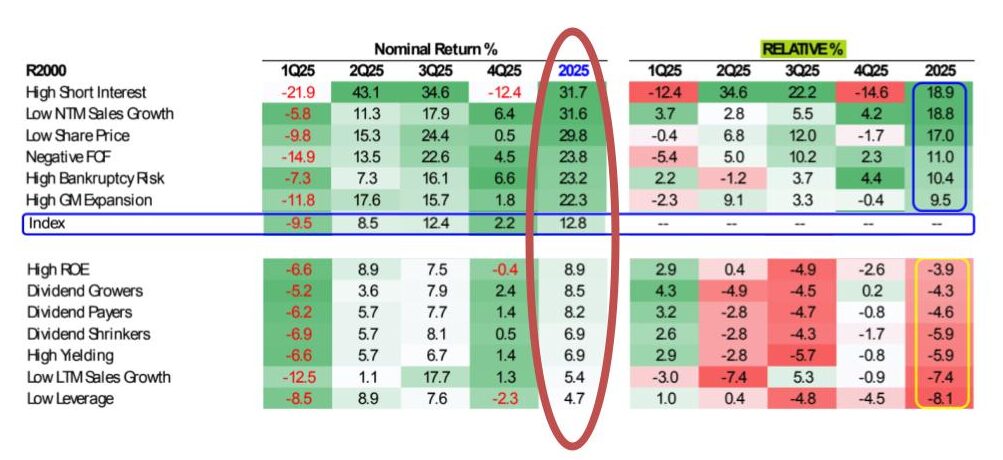
Source: Furey Research Partners
The Worst Year for Quality Since 1994
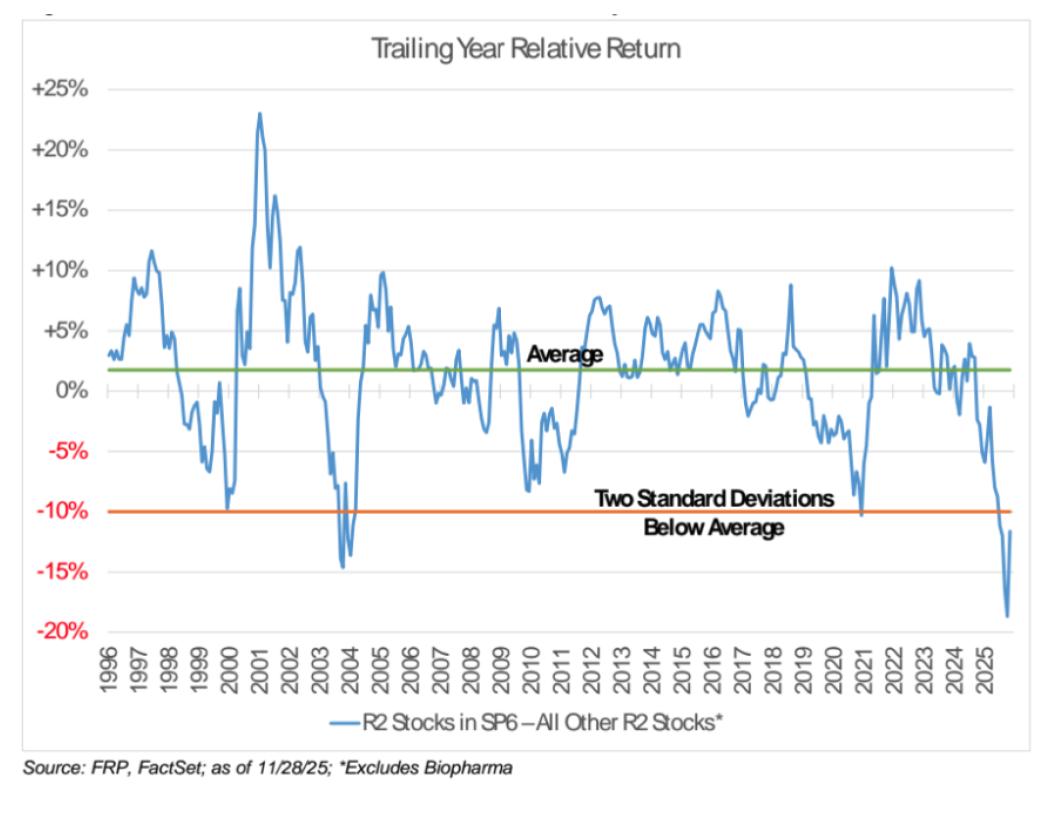
One way to visualize this dynamic is to compare the trailing returns of S&P 600 stocks — which require four consecutive quarters of profitability for inclusion — against all other stocks in the Russell 2000. This is essentially a chart of profitable companies versus unprofitable ones.
In 2025, the relative return gap was the widest it has been since the S&P 600 launched in 1994. This was more than a two standard deviation event — occurring less than 5% of the time in the index’s history.
What gives us confidence is what typically follows these extremes. Historically, when this divergence reaches the level we saw in 2025, quality stocks have experienced strong snapback periods of outperformance, reverting back toward long-term averages. If history serves as a guide, 2026 could mark the beginning of that reversion.
A Case Study in Quality: Grand Canyon Education
To bring this abstract factor discussion to life, consider Grand Canyon Education (LOPE) — a name that has been a top-five holding across our strategies since inception.
Grand Canyon exemplifies what we look for in every investment: a superior business, an exceptional management team, and an attractive valuation. The management team has been in place for over 18 years — nearly unheard of in public markets where the average C-suite tenure is less than five years. In 2025, LOPE grew earnings by 9%, its return on equity ran at roughly three times the Russell 2500 Value Index, net margins were strong, the balance sheet was clean, and the stock traded at a discount to the index on a price-to-free-cash-flow basis.
And yet, the stock was up just 1.5% for the year while the benchmark gained 12.8%.
There was nothing wrong with the business. Quality simply was not what the market rewarded. We believe Grand Canyon — and companies like it — represent exactly the kind of dislocation that creates opportunity for patient investors.
The Historical Playbook for Low-Quality Rallies
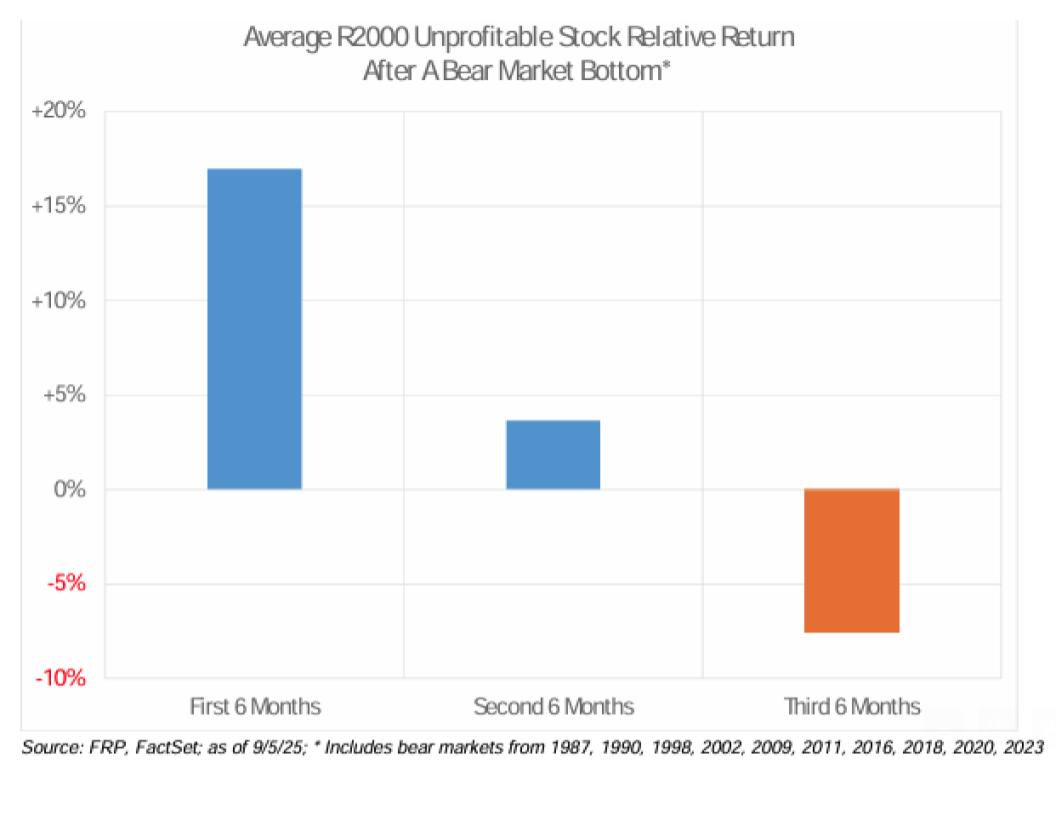 We have studied the pattern coming out of the last 10 bear markets, and the data follows a remarkably consistent sequence. In the first six months following the onset of a low-quality rally, unprofitable stocks typically outperform profitable ones by over 15%. In the subsequent six months, that advantage narrows to roughly 3% to 5%. And then in the following six-month period, quality reasserts itself and low-quality names begin to underperform.
The current cycle started on April 8, 2025. Based on historical precedent, the inflection point toward quality outperformance would be expected right around now — and early evidence suggests it may already be underway. In recent weeks, quality factors have begun to meaningfully outperform low-quality factors on a relative basis.
Small Caps: Historically Cheap and Positioned for Growth
The case for small caps extends beyond the quality rotation. Small-cap stocks are trading at roughly the same relative discount to large caps that we last saw in March of 1999 — one of the most favorable starting points for small-cap investing in modern market history.
The earnings growth story is also shifting. The Magnificent 7 enjoyed superior earnings growth relative to small caps in 2023, 2024, and 2025. But consensus Street forecasts for 2026 show small-cap earnings growth surpassing that of the mega-cap leaders for the first time in years. When you combine that growth advantage with historically cheap valuations, the setup is compelling.
We have now experienced 15 years of small-cap underperformance relative to large caps. We believe markets are inherently cyclical, and the sheer concentration of capital in a handful of mega-cap names means that even modest reallocation into small caps could create a meaningful tailwind for the asset class.

Discipline Over Narrative
2025 was a year that tested conviction. It would have been easy to chase momentum into speculative names with poor fundamentals. We chose not to, and our process is designed to prevent exactly that. We invest in quality companies that make money, earn their cost of capital, maintain strong balance sheets, and are led by proven management teams. These biases are built into our portfolios because over the long term, they have been rewarded.
The last time the market felt similar to today — when Industrials and Financials were rising on the same days that highflying tech names were falling — was April 2000. We are not calling a top in speculative growth. But we are saying that the ingredients for a meaningful rotation into quality small caps are in place, and we are positioned for it.
We see the structural advantages of avoiding unprofitable companies and concentrating in high-quality businesses has having potential to compound over full market cycles. After 2025, we believe the starting point for that compounding is better than it has been in years.
Disclosures
This material is provided for informational purposes only and is not intended as investment advice or a recommendation to buy or sell any security. Discussion of specific securities, including Grand Canyon Education (LOPE), is for illustrative purposes only and should not be construed as a recommendation to buy or sell any security. The inclusion of a company in this discussion does not guarantee it will remain in the portfolio. Full composite performance for all Riverwater strategies is available upon request.
Past performance is not indicative of future results. All investments involve risk, including the potential loss of principal. Concentrated portfolios may experience greater volatility than more diversified approaches and may experience extended periods of underperformance relative to broader indices, as our strategies experienced in 2025. Historical patterns referenced in this commentary, including quality factor reversions, bear market recovery sequences, and small-cap vs. large-cap relative return cycles, are not indicative of future results. There is no guarantee that past patterns will repeat, that a rotation into quality or small-cap stocks will occur on any particular timeline, or that our portfolios will benefit from such a rotation.
Forward-looking statements in this commentary, including references to consensus earnings growth forecasts and potential market rotations, reflect our current beliefs and expectations. Forecasts are inherently uncertain and actual results may differ materially. Valuations alone do not predict future returns. Any opinions expressed herein are subject to change without notice.
Riverwater Partners claims compliance with the Global Investment Performance Standards (GIPS®). To receive a GIPS-compliant presentation and/or the firm’s list of composite descriptions, please contact us at info@riverwaterpartners.com.
The Russell 2000 Index, Russell 2500 Value Index, and S&P SmallCap 600 Index are unmanaged indices and cannot be invested in directly. Index returns do not reflect fees, expenses, or transaction costs.
Factor return data and manager performance statistics sourced from Furey Research Partners.¹ S&P 600 vs. Russell 2000 quality analysis based on Riverwater Partners research using S&P Dow Jones Indices data.² Grand Canyon Education financial data sourced from company filings and Bloomberg as of December 31, 2025.³ ⁴ Small-cap vs. large-cap valuation comparisons based on Russell 2000 and S&P 500 forward P/E ratios sourced from FTSE Russell and Bloomberg.⁵ Consensus earnings growth estimates sourced from Bloomberg and FactSet as of January 2026.⁶